Case Study: Building an Autonomous CI/CD Pipeline Agent for a Large-Scale Monorepo
This post applies the 9-step case study structure from the GenAI System Design Framework.
Problem Statement
A large engineering organization runs a monorepo with 10,000+ build targets across 50+ teams. The CI/CD pipeline processes 2,000-4,000 pull requests per week. On any given day, 8-15% of CI runs fail. Some failures are flaky tests (network timeouts, race conditions in integration tests). Some are genuine build breaks (incompatible dependency bumps, missing imports after a refactor). Some are infrastructure issues (runner pool exhaustion, cache corruption).
Today, a failed CI run means a developer stares at build logs, digs through dependency graphs, and either fixes the issue or restarts the pipeline hoping the flake goes away. Across the organization, developers spend an estimated 15-20% of their CI-related time on diagnosis and triage, not on actual fixes. For a 500-person engineering org, that’s 75-100 engineer-hours per week spent reading build logs.
What we’re building: an agent that monitors CI events, diagnoses build and test failures, and takes autonomous corrective action within defined safety boundaries. Not a chatbot that answers questions about CI. An event-driven system that watches the pipeline, forms hypotheses about failure causes, and either fixes the problem or escalates with a structured diagnosis.
Primary users: developers whose PRs fail CI. They see either an auto-fix (test passes on retry, dependency pinned, import added) or a diagnosis comment on their PR explaining what went wrong and what to do.
Secondary users: platform/infra teams who manage the CI infrastructure, monitor the agent’s actions, and tune its autonomy boundaries.
What This System Is Not
This is not a code generation agent. It doesn’t write new features or refactor code. It diagnoses and fixes CI failures within a narrow, well-defined scope. The distinction matters because the autonomy boundaries are completely different. A code generation agent needs human review on every output. A CI agent that retries a flaky test or pins a dependency version can operate autonomously because the blast radius is bounded and the action is reversible.
It’s also not a CI/CD platform replacement. It sits alongside your existing CI system (GitHub Actions, Buildkite, Jenkins, whatever). It consumes events from the CI system and acts through the same interfaces developers use (git commits, PR comments, pipeline restarts). It doesn’t replace your build system or test framework.
Step 0: Why GenAI?
Most CI failures fall into a small number of categories: flaky tests, dependency conflicts, import errors, environment drift, and infrastructure issues. A rule-based system that pattern-matches on common error strings handles maybe 40-50% of these. “Connection refused” in an integration test log? Retry. “Module not found”? Check the import path against recent file moves.
The rule-based system falls apart on the other 50-60%. A test fails with a cryptic assertion error. The build log shows a type mismatch but the actual root cause is a transitive dependency bump three levels deep that changed a return type. The error message says one thing but the actual fix is somewhere else entirely. Diagnosis requires reading the error, cross-referencing it with the diff, checking the dependency graph, and forming a hypothesis. That’s reasoning, not pattern matching.
The cost justification is straightforward. If the agent successfully diagnoses and auto-fixes 30% of CI failures without developer intervention, at 300-500 failures per week, that’s 90-150 failures resolved automatically. At an average of 20 minutes of developer time per failure (reading logs, diagnosing, fixing, re-running), that’s 30-50 developer-hours saved per week. The inference cost to diagnose a failure is roughly $0.05-0.15 per failure (depending on log size and number of hypothesis iterations). At 500 failures per week, that’s $25-75 per week in inference costs to save 30-50 hours of engineer time.
The math only works if the agent is right most of the time. An agent that auto-fixes a failure incorrectly (introduces a worse bug, pins a dependency to a vulnerable version, silently masks a real issue) costs more than the time it saves. This is why the autonomy boundaries matter more than the diagnosis accuracy.
Step 1: Requirements
Functional Requirements
- Monitor CI pipeline events (build failures, test failures, infrastructure errors) in real time
- Diagnose root cause of failures by analyzing build logs, test output, diffs, dependency graphs, and recent commit history
- Take autonomous corrective action for well-understood failure categories (retry flaky tests, pin dependencies, add missing imports)
- Escalate to developers with a structured diagnosis when the failure is outside autonomous scope
- Track diagnosis accuracy and action outcomes over time to improve routing decisions
Non-Functional Requirements
- Latency: Diagnosis should complete within 2-3 minutes of CI failure. Developers shouldn’t context-switch away before the agent responds. If diagnosis takes 10 minutes, the developer has already started debugging manually and the agent’s output is wasted.
- Safety: No autonomous action should be irreversible or affect targets outside the failing PR’s scope. This is the single most important constraint.
- Accuracy: False positive diagnosis rate under 10%. Better to say “I don’t know” than to confidently point developers at the wrong file. False fixes (auto-fix that introduces a new issue) must be under 1%.
- Availability: 99% uptime during business hours. CI failures don’t stop on weekends but the agent’s value is highest during active development hours.
Scale Assumptions
A large monorepo with 10,000+ build targets generates significant CI volume:
| Metric | Value |
|---|---|
| PRs per week | 2,000-4,000 |
| CI runs per week | 8,000-15,000 (multiple runs per PR: initial, retries, updates) |
| CI failure rate | 8-15% of runs |
| Failures per week | 700-2,000 |
| Average build log size | 5,000-50,000 lines |
| Average test output size | 500-5,000 lines |
| Dependency graph depth | Up to 8 levels of transitive dependencies |
| Affected targets per file change | Median 3, P99 over 200 |
The throughput requirement is modest (a few failures per minute at peak), but the context per failure is large. A single diagnosis might require reading 10,000 lines of build log, the PR diff, and the dependency graph for 50 targets. That’s a lot of tokens.
Quality Metrics
| Metric | Target | Why this number |
|---|---|---|
| Auto-fix success rate | Over 85% | Below this, developers lose trust and ignore the agent |
| Diagnosis accuracy (when escalating) | Over 75% | Correct root cause identification, verified by developer action |
| Mean time to diagnosis | Under 3 minutes | Beyond this, developer has already started debugging |
| False fix rate | Under 1% | Auto-fix that makes things worse. Trust destroyer |
| Blast radius violation rate | 0% | Agent modifying targets outside the PR scope. Hard failure |
Trade-offs to Acknowledge
| Trade-off | Option A | Option B | Our lean |
|---|---|---|---|
| Autonomous fix vs always escalate | Auto-fix reduces MTTR, risk of cascading failures | Always escalate is safer, slower | Tiered autonomy. Auto-fix for safe actions, escalate for risky ones |
| Single hypothesis vs parallel multi-hypothesis | Cheaper, sequential, slower for complex failures | 3x cost, faster root cause for multi-factor failures | Single hypothesis first, fan out only if first hypothesis fails |
| Stateless per-run vs persistent episodic memory | Simpler, no state management | Can learn from past failures of the same target | Stateless to start. Add episodic memory for high-failure-rate targets later |
| Fixed tool catalog vs dynamic tool discovery | Predictable, testable, limited scope | More flexible, harder to bound blast radius | Fixed catalog. Predictability is more important than flexibility for autonomous actions |
Step 2: Architecture
Event-Driven, Not Request-Response
This agent is not invoked by a user asking a question. It’s triggered by CI events. That’s a fundamental architectural difference from most agentic systems. There’s no conversation, no multi-turn dialogue, no session state. A CI failure event arrives, the agent processes it, and it produces either an action (retry, fix commit, dependency pin) or a diagnosis (PR comment with root cause analysis).
The event-driven model means the agent needs to be always-on, consuming from an event stream. It doesn’t scale up when users ask questions and scale down when they don’t. It scales with CI pipeline throughput, which correlates with engineering team activity (weekday business hours peak, nights and weekends trough).
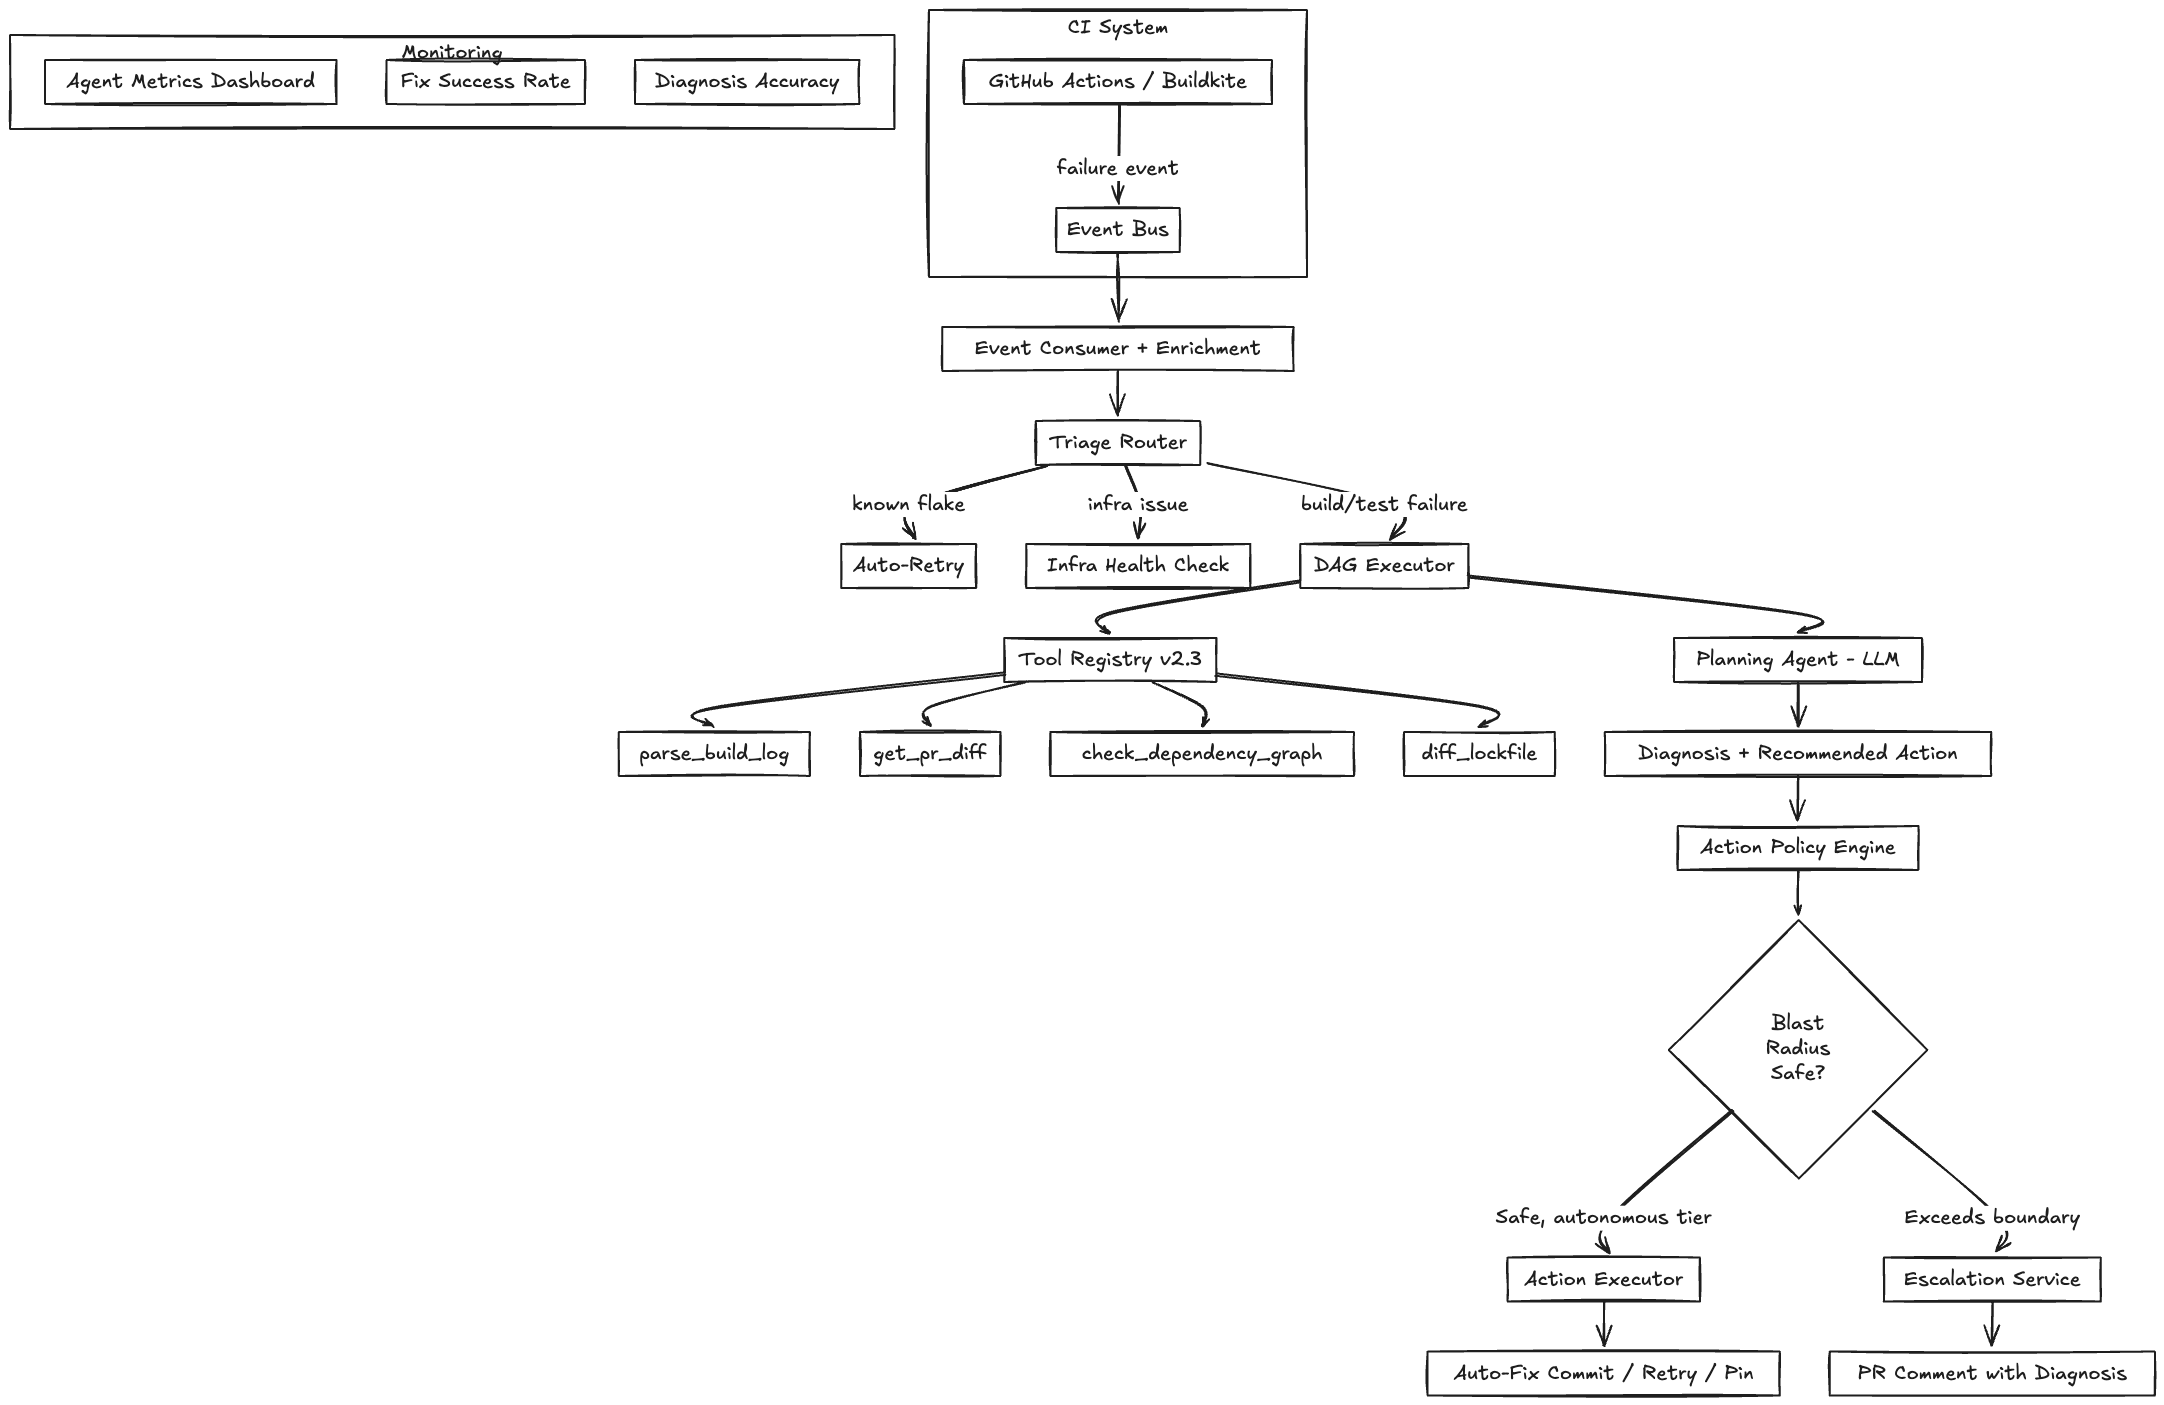
Component Overview
Event Bus: CI system publishes events (build started, build failed, test failed, deploy triggered) to a message queue (Kafka, SQS, or the CI system’s native webhook). The agent subscribes to failure events.
Triage Router: A lightweight classifier that categorizes the failure before the LLM sees it. Pattern matching on error strings, exit codes, and failure location. Categories: flaky test (known flake), dependency error, build error, test failure (genuine), infrastructure error, unknown. The router determines which diagnostic path to take and whether the failure even needs LLM analysis (known flakes can be auto-retried without diagnosis).
DAG Executor: The core orchestration engine. Each diagnostic path is a directed acyclic graph (DAG) of analysis steps. The executor manages step dependencies, parallel execution where possible, timeout handling, and result aggregation. This is not an LLM. It’s a deterministic workflow engine (similar to Temporal or Prefect) that coordinates the diagnostic steps.
Tool Registry: A versioned catalog of diagnostic tools the agent can invoke. Each tool has a defined input schema, output schema, blast radius classification, and version. Tools are the agent’s interface to the monorepo and CI infrastructure.
Planning Agent: The LLM-powered component. Given a failure context (error logs, diff, dependency info), it forms a diagnosis hypothesis, selects tools to test that hypothesis, interprets results, and either confirms the diagnosis or backtracks to try a different hypothesis.
Action Executor: Takes a confirmed diagnosis and recommended action, validates it against the blast radius policy, and executes. Separate from the Planning Agent deliberately. The Planning Agent proposes actions. The Action Executor decides whether those actions are safe to execute autonomously.
Escalation Service: When the agent can’t diagnose the failure or the recommended action exceeds autonomy boundaries, it posts a structured diagnosis to the PR as a comment. The comment includes: failure category, hypothesis tested, evidence collected, and recommended developer action.
The DAG, Not a Chat Loop
Most agentic systems are structured as ReAct loops: observe, think, act, repeat. That works for conversational agents where the interaction is open-ended. For CI diagnosis, the structure is more constrained. You know the failure type (from the triage router), you know what information you need to collect (build logs, diff, dependency graph), and you know the diagnostic steps in advance for each failure category.
| ReAct Loop | Diagnostic DAG | |
|---|---|---|
| Structure | Open-ended, model decides next step | Predefined steps per failure category, model fills in the reasoning |
| Predictability | Low. Model might take 3 steps or 15 | High. Each DAG has a known step count and timeout |
| Cost | Variable. Long reasoning chains get expensive | Bounded. DAG steps are finite and budgeted |
| Debuggability | Hard. Trace is a stream of thoughts | Easy. Each DAG step has defined inputs and outputs |
| Parallelism | Sequential by default | Steps without dependencies run in parallel |
The DAG for a dependency error diagnosis looks roughly like:
1. Parse build log (extract error message, failing target, dependency references)
   |
   ├── 2a. Fetch PR diff (what changed in this PR?)
   |
   ├── 2b. Fetch dependency graph (what does the failing target depend on?)
   |
   └── 2c. Fetch recent dependency updates (any lockfile changes in the last 24h?)
   |
3. Planning Agent: form hypothesis from (1, 2a, 2b, 2c)
   |
4. Test hypothesis (run targeted tool based on hypothesis)
   |
5. Confirm or backtrack
   |
6. Recommend action
Steps 2a, 2b, and 2c run in parallel because they’re independent data fetches. Step 3 waits for all three. This parallelism cuts diagnosis latency significantly compared to a sequential ReAct loop that would fetch each piece of information one at a time.
Step 3: Planning Loops with Backtracking
The Planning Agent is where the LLM reasoning lives. Given a failure context, it needs to form a hypothesis about the root cause, test it, and either confirm or backtrack. This is fundamentally a tree search problem.
The Hypothesis Tree
Consider a test failure where the error message is AssertionError: expected 200, got 500. The Planning Agent doesn’t know yet whether this is:
- A genuine bug in the PR’s code changes
- A flaky test (the test service was temporarily down)
- A dependency change that altered API behavior
- An environment issue (test database wasn’t properly seeded)
Each of these is a hypothesis. The agent needs to test them in a sensible order (cheapest and most likely first) and backtrack when a hypothesis is ruled out.
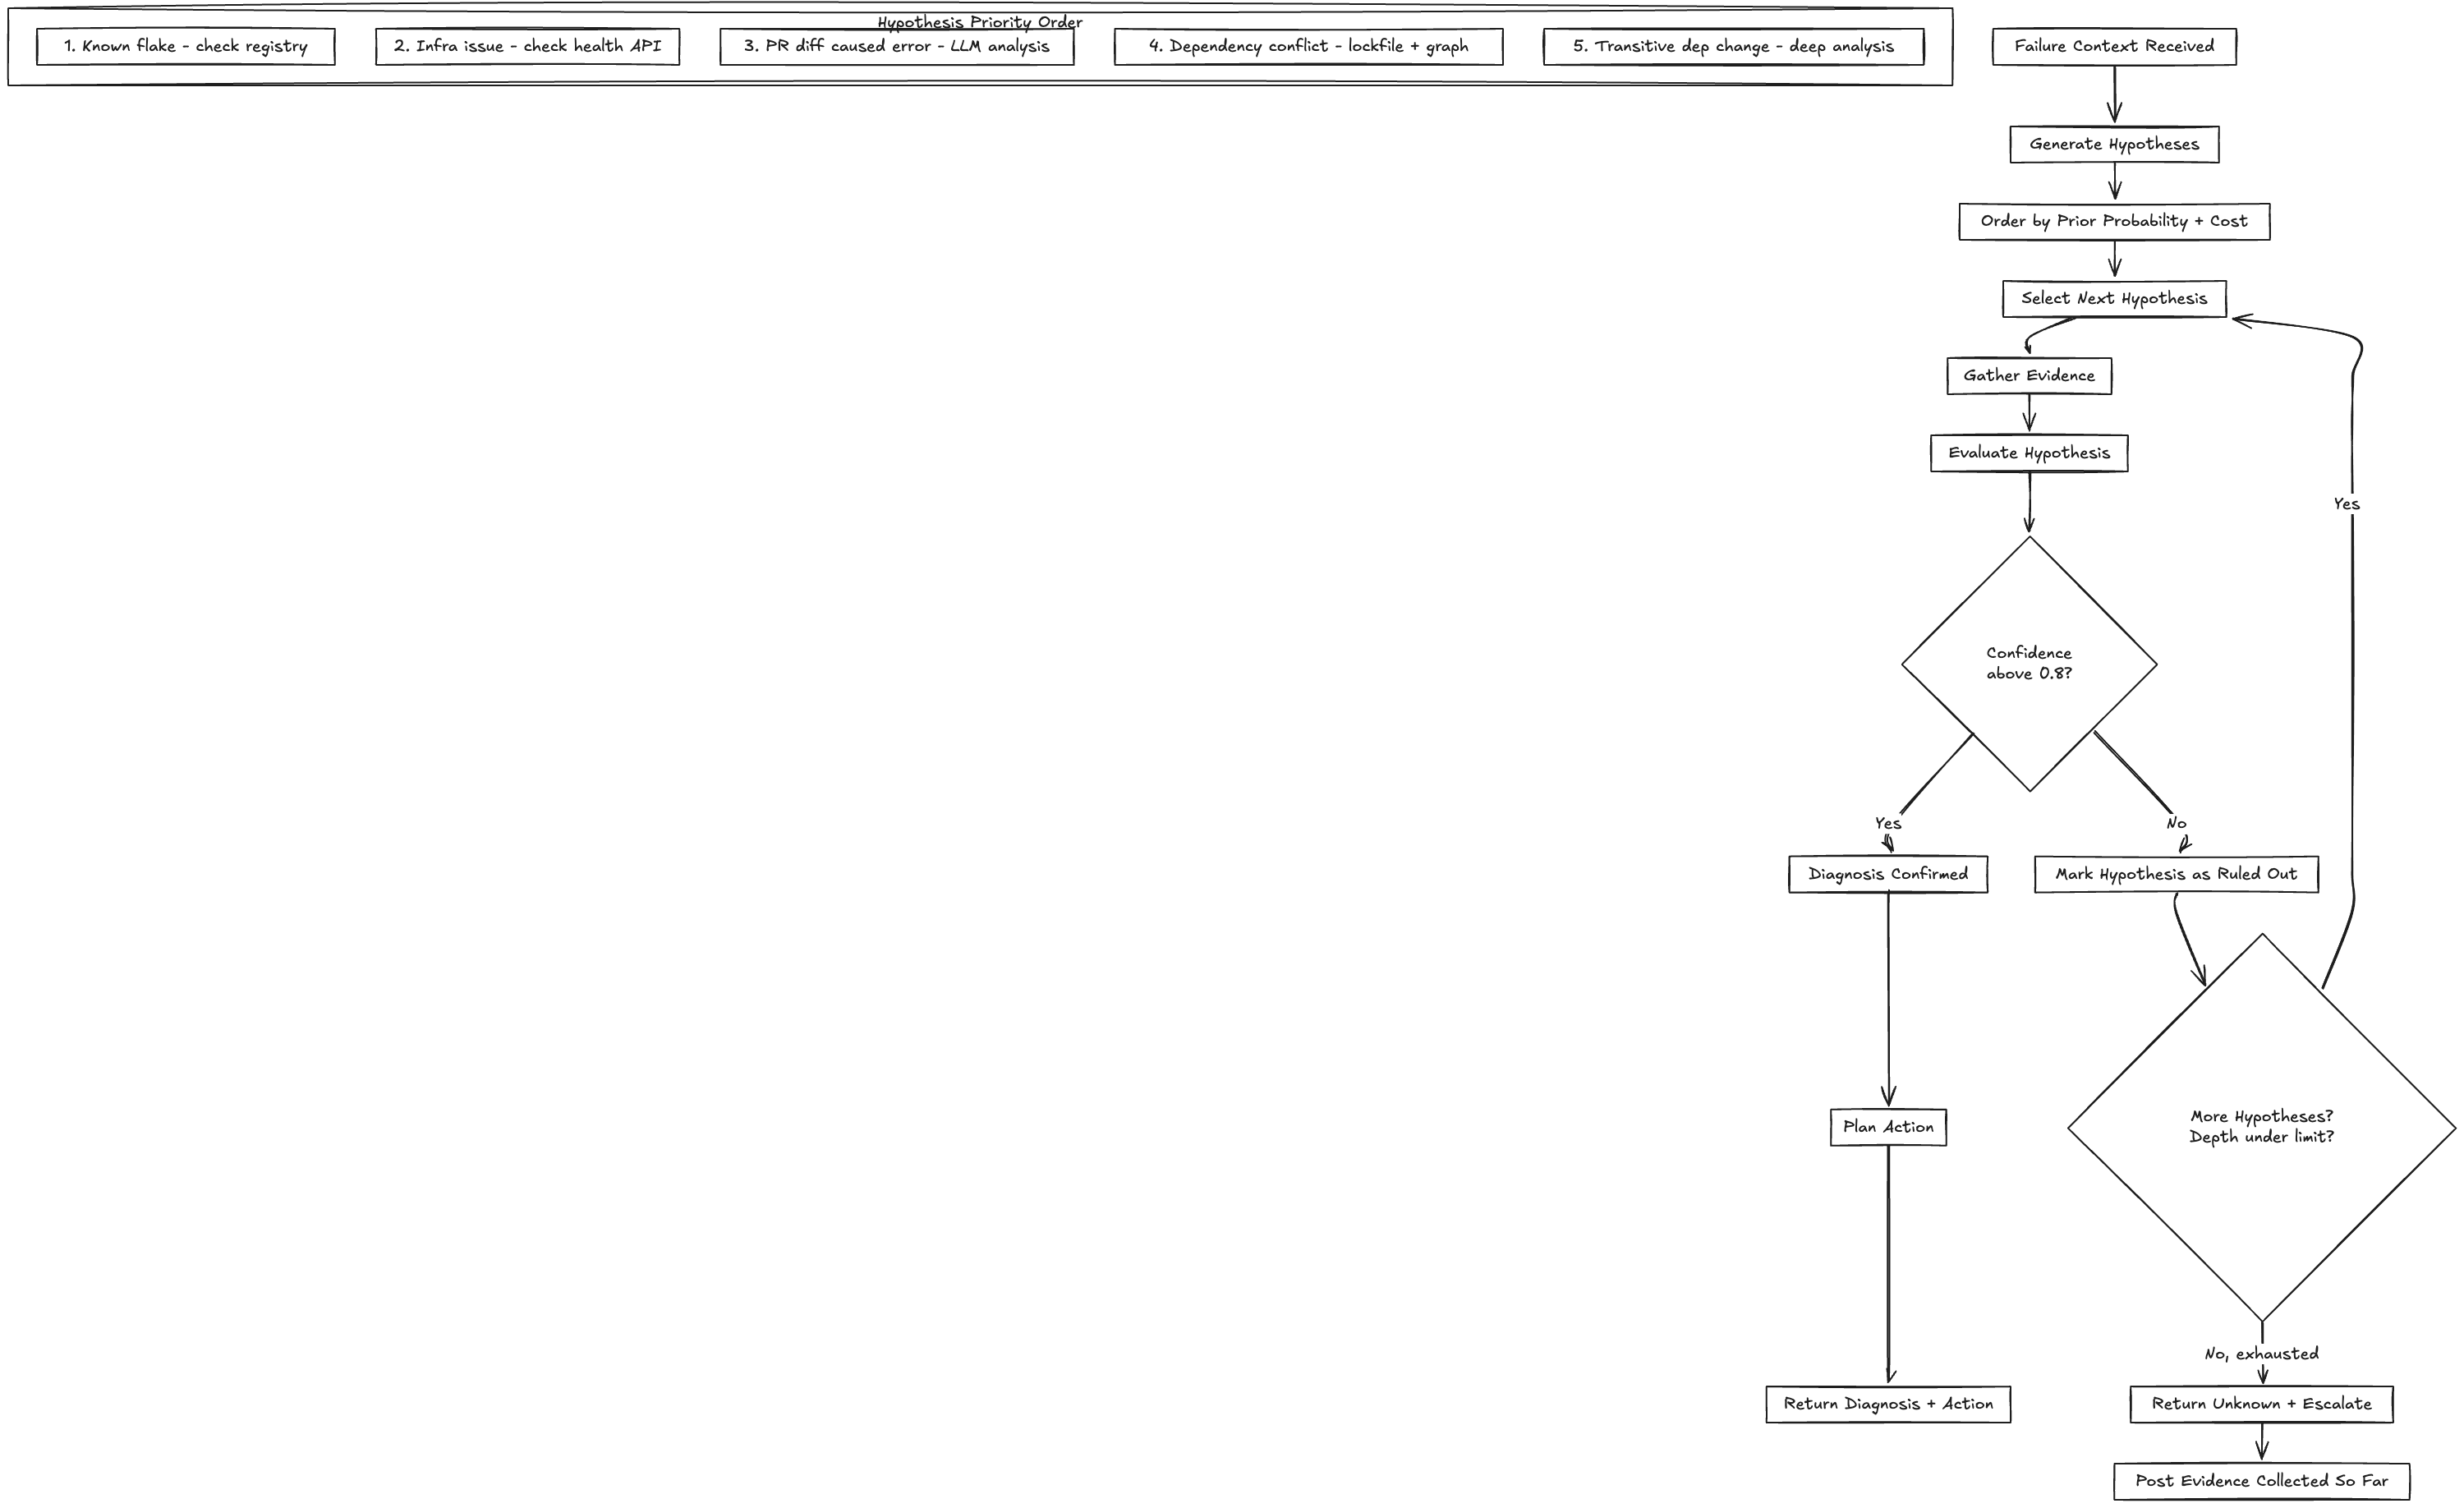
class DiagnosticPlanner:
    def diagnose(self, failure_context: FailureContext) -> Diagnosis:
        hypotheses = self.generate_hypotheses(failure_context)
        # Ordered by prior probability (from historical data) and test cost

        for hypothesis in hypotheses[:MAX_HYPOTHESES]:  # Depth limit: 3-4
            evidence = self.gather_evidence(hypothesis, failure_context)

            verdict = self.evaluate_hypothesis(hypothesis, evidence)

            if verdict.confidence > 0.8:
                return Diagnosis(
                    root_cause=hypothesis,
                    evidence=evidence,
                    confidence=verdict.confidence,
                    recommended_action=self.plan_action(hypothesis, evidence)
                )

            # Backtrack: hypothesis didn't hold, try next one
            failure_context.ruled_out.append(hypothesis)

        # All hypotheses exhausted or depth limit reached
        return Diagnosis(
            root_cause="unknown",
            evidence=self.all_evidence_collected,
            confidence=0.0,
            recommended_action="escalate_to_developer"
)Hypothesis Ordering
The order matters more than it seems. Testing a hypothesis has a cost (LLM calls, tool invocations, time). If you test the expensive hypothesis first, you burn budget and latency even when the cheap hypothesis would have been correct.
| Hypothesis | Test Cost | Prior Probability | Test Method |
|---|---|---|---|
| Flaky test (known flake) | Near zero | Check flake database | Lookup in flake registry |
| Flaky test (unknown flake) | Low | Retry the test | Re-run test, compare results |
| Import/build error from PR diff | Medium | Diff analysis | Parse error against changed files |
| Dependency version conflict | Medium | Lockfile diff + dep graph traversal | Compare lockfile changes against error |
| Transitive dependency behavior change | High | Dep graph + changelog analysis | Deep dependency chain analysis |
| Environment/infrastructure issue | Low | Check infra health dashboard | API call to infra monitoring |
The ordering heuristic: check the flake registry first (milliseconds, zero LLM cost). Then check infrastructure health (also fast, no LLM). Then analyze the PR diff against the error (needs LLM, but scoped). Then go into dependency analysis (expensive, lots of context). This ordering means the cheapest 60-70% of failures are diagnosed without the expensive hypothesis paths.
Historical data improves this over time. If target X has failed 12 times in the last month and 10 of those were flaky, the prior probability of “flaky test” for target X is very high. The agent should retry before doing any analysis. More on this in the episodic memory discussion in the Going Deeper section.
Depth Limiting
The planning loop needs a hard depth limit. Without it, the agent can spiral into increasingly speculative hypotheses, burning tokens and time. In practice, 3-4 hypotheses is the right limit. If the agent has tested 4 hypotheses and none hold, the failure is complex enough to warrant human investigation. The agent’s value at that point is the evidence it has already collected and the hypotheses it has ruled out, not a 5th guess.
The depth limit also bounds cost. Each hypothesis test costs roughly $0.01-0.05 in inference (depending on context size). At 4 hypotheses max, the worst-case per-failure cost is $0.20. Average cost is much lower because most failures are diagnosed on the first or second hypothesis.
When to Fan Out
The default is single-hypothesis sequential search: test one hypothesis at a time. But for certain failure categories, parallel hypothesis testing is worth the extra cost.
When: build failures that could be either a direct code issue OR a transitive dependency issue. These two hypotheses require completely different evidence (diff analysis vs dependency graph traversal), and the evidence gathering can run in parallel.
When not: flaky test vs genuine test failure. These are tested sequentially because the test for flakiness (retry the test) also provides evidence for genuine failure (if the retry passes, it was flaky; if it fails again, it’s genuine). Running both in parallel wastes the retry.
Step 4: Blast Radius Estimation and Action Boundaries
This is the section that separates a useful CI agent from a dangerous one. The agent can diagnose failures all day and the worst outcome is a wrong diagnosis (annoying, not destructive). But the moment the agent takes autonomous action, fixing code, pinning dependencies, restarting pipelines, the blast radius question becomes critical.
What Is Blast Radius?
In a monorepo, a single file change can affect many build targets. Changing a utility function used by 200 services means a bug in that change breaks 200 builds. The blast radius of a change is the number of targets affected by that change.
The agent needs to estimate blast radius before taking any autonomous action. The estimation uses the monorepo’s dependency graph:
File changed: src/lib/utils/retry.ts
  └── Direct importers: 12 packages
       └── Transitive dependents: 47 packages
            └── Test targets affected: 183 test suites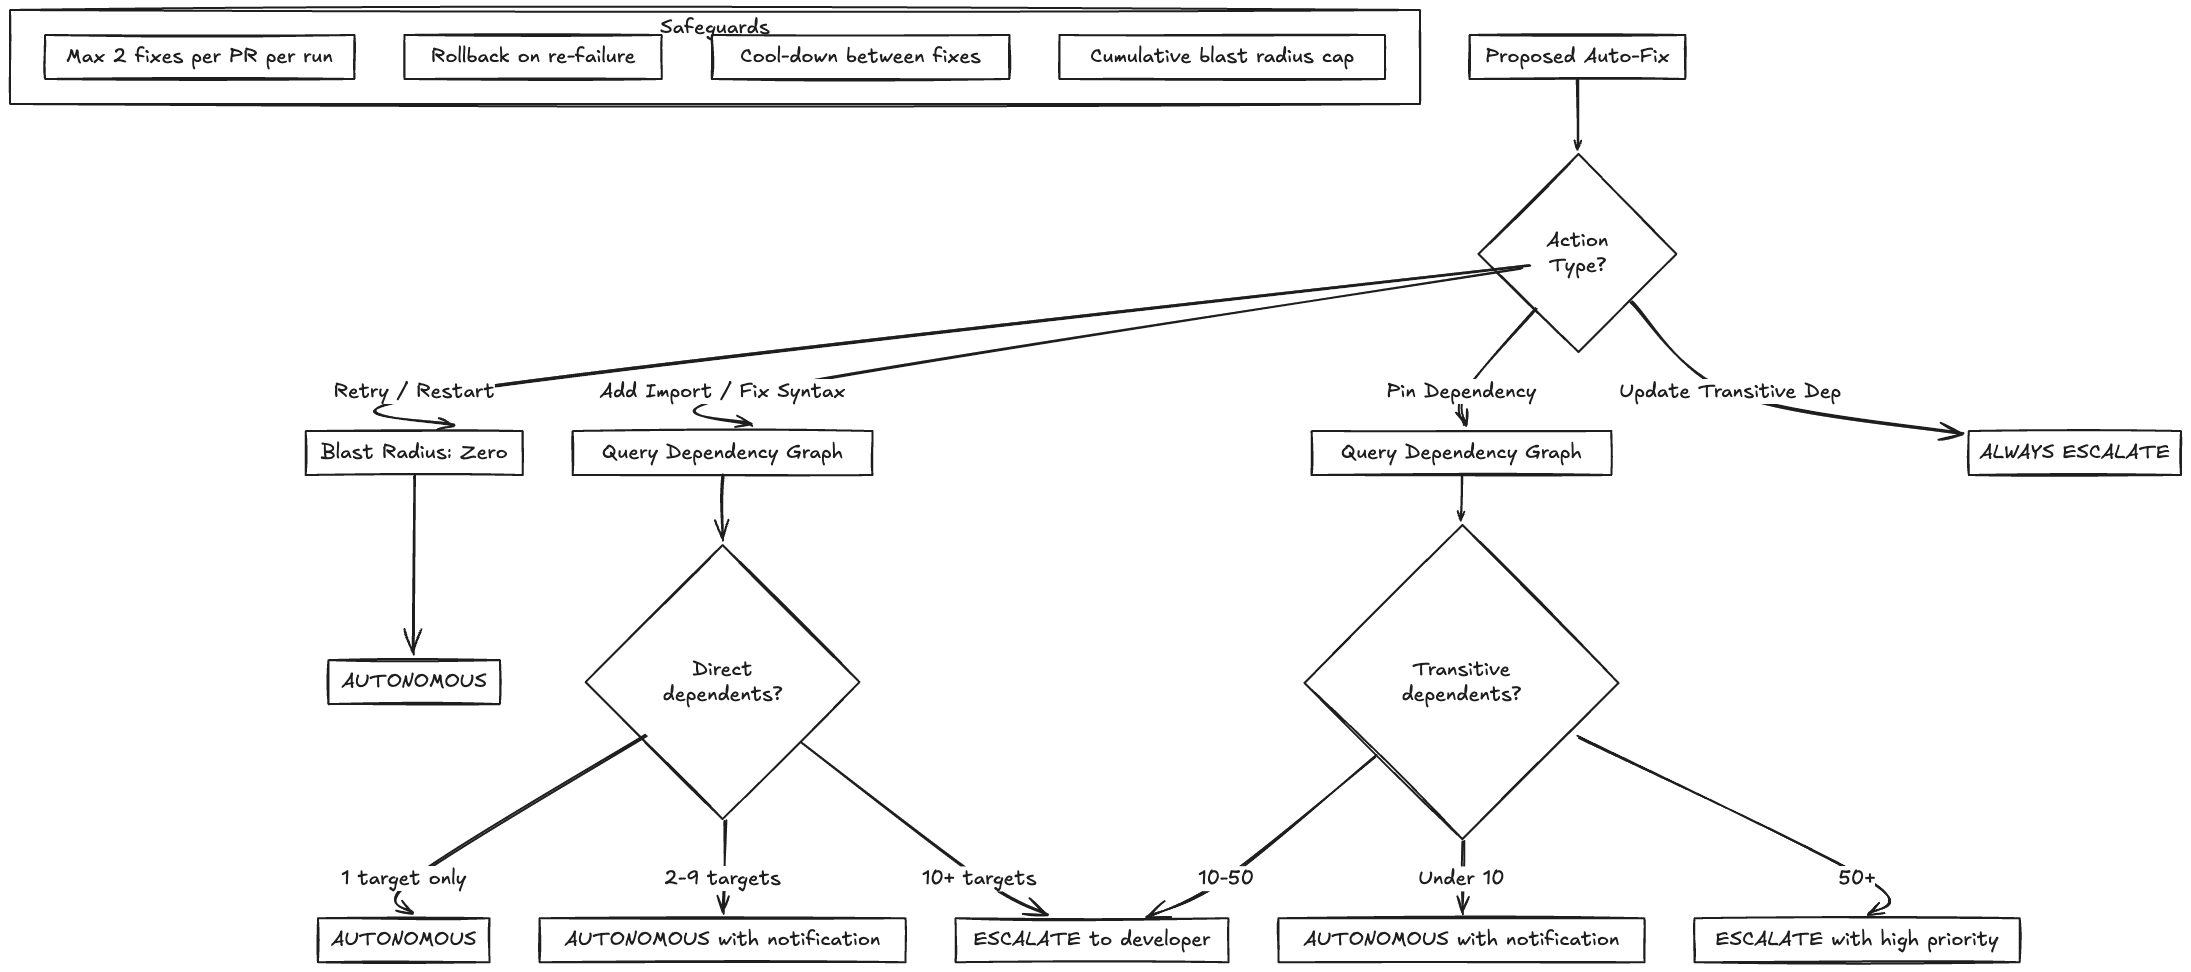
Action Tiers
Not all actions have the same risk profile. The agent’s autonomy is tiered based on action type and blast radius:
| Action | Blast Radius | Reversibility | Autonomy Level |
|---|---|---|---|
| Retry a test | Zero (no code change) | Fully reversible | Fully autonomous |
| Restart CI pipeline | Zero (no code change) | Fully reversible | Fully autonomous |
| Add a missing import | 1 target (the failing one) | Git revert | Autonomous if target count is 1 |
| Pin a direct dependency | N targets (all importers) | Git revert + lockfile restore | Autonomous if N is under 10, escalate otherwise |
| Update a transitive dependency | Unknown (could be hundreds) | Complex rollback | Always escalate |
| Modify shared library code | Hundreds of targets | Git revert but retesting all affected targets is expensive | Always escalate |
| Modify CI configuration | All targets | Potentially pipeline-breaking | Always escalate |
The boundaries are intentionally conservative. The agent should never surprise a developer with a change they didn’t expect. Auto-retrying a flaky test is invisible and costless. Auto-modifying a shared utility that 200 services depend on is a completely different risk profile, even if the agent is 95% confident in its diagnosis.
The Blast Radius Estimator
class BlastRadiusEstimator:
    def estimate(self, proposed_change: Change) -> BlastRadius:
        affected_files = proposed_change.files_modified

        direct_dependents = set()
        for f in affected_files:
            direct_dependents.update(
                self.dep_graph.get_direct_dependents(f)
            )

        transitive_dependents = set()
        for target in direct_dependents:
            transitive_dependents.update(
                self.dep_graph.get_transitive_closure(target)
            )

        test_targets = {
            t for t in transitive_dependents
            if self.dep_graph.is_test_target(t)
        }

        return BlastRadius(
            files_modified=len(affected_files),
            direct_dependents=len(direct_dependents),
            transitive_dependents=len(transitive_dependents),
            test_targets_affected=len(test_targets),
            tier=self.classify_tier(
                len(transitive_dependents),
                proposed_change.change_type
            )
        )

    def classify_tier(self, dependent_count: int, change_type: str) -> str:
        if change_type == "retry" or change_type == "restart":
            return "autonomous"
        if change_type == "add_import" and dependent_count <= 1:
            return "autonomous"
        if change_type == "pin_dependency" and dependent_count < 10:
            return "autonomous"
        if dependent_count >= 10:
            return "escalate"
return "escalate" # Default to escalate for unknown typesCascading Fix Prevention
The most dangerous failure mode for a CI agent is the cascading fix loop. The agent fixes failure A, which triggers a rebuild. The rebuild surfaces failure B (which was masked by A or caused by the fix for A). The agent fixes B, which triggers another rebuild. And so on.
This happens more often than you’d think. A common scenario: the agent pins dependency X to fix a version conflict. The pinned version of X is incompatible with dependency Y (which was fine with the previous version of X). Now Y fails. The agent pins Y. But Y’s pinned version needs a different version of Z. Three auto-fixes in and you’ve created a dependency mess that’s harder to untangle than the original failure.
Prevention:
| Safeguard | Implementation |
|---|---|
| Fix count limit per PR | Maximum 2 autonomous fixes per PR per CI run. After 2, escalate regardless |
| Cool-down period | After an auto-fix, wait for the full CI run to complete before diagnosing new failures. No fix-on-fix |
| Change scope tracking | Track cumulative blast radius across fixes. If total affected targets exceeds threshold, stop and escalate |
| Rollback on re-failure | If the auto-fix commit’s CI run fails, automatically revert the fix commit and escalate |
The rollback-on-re-failure safeguard is particularly important. If the agent’s fix made things worse, reverting it immediately contains the damage. The developer sees: “Agent attempted auto-fix, fix caused new failures, fix was reverted. Original diagnosis and attempted fix are in the PR comment for your reference.”
Step 5: Event-Driven DAG Execution
The Event Flow
A CI failure moves through the system in a defined sequence:
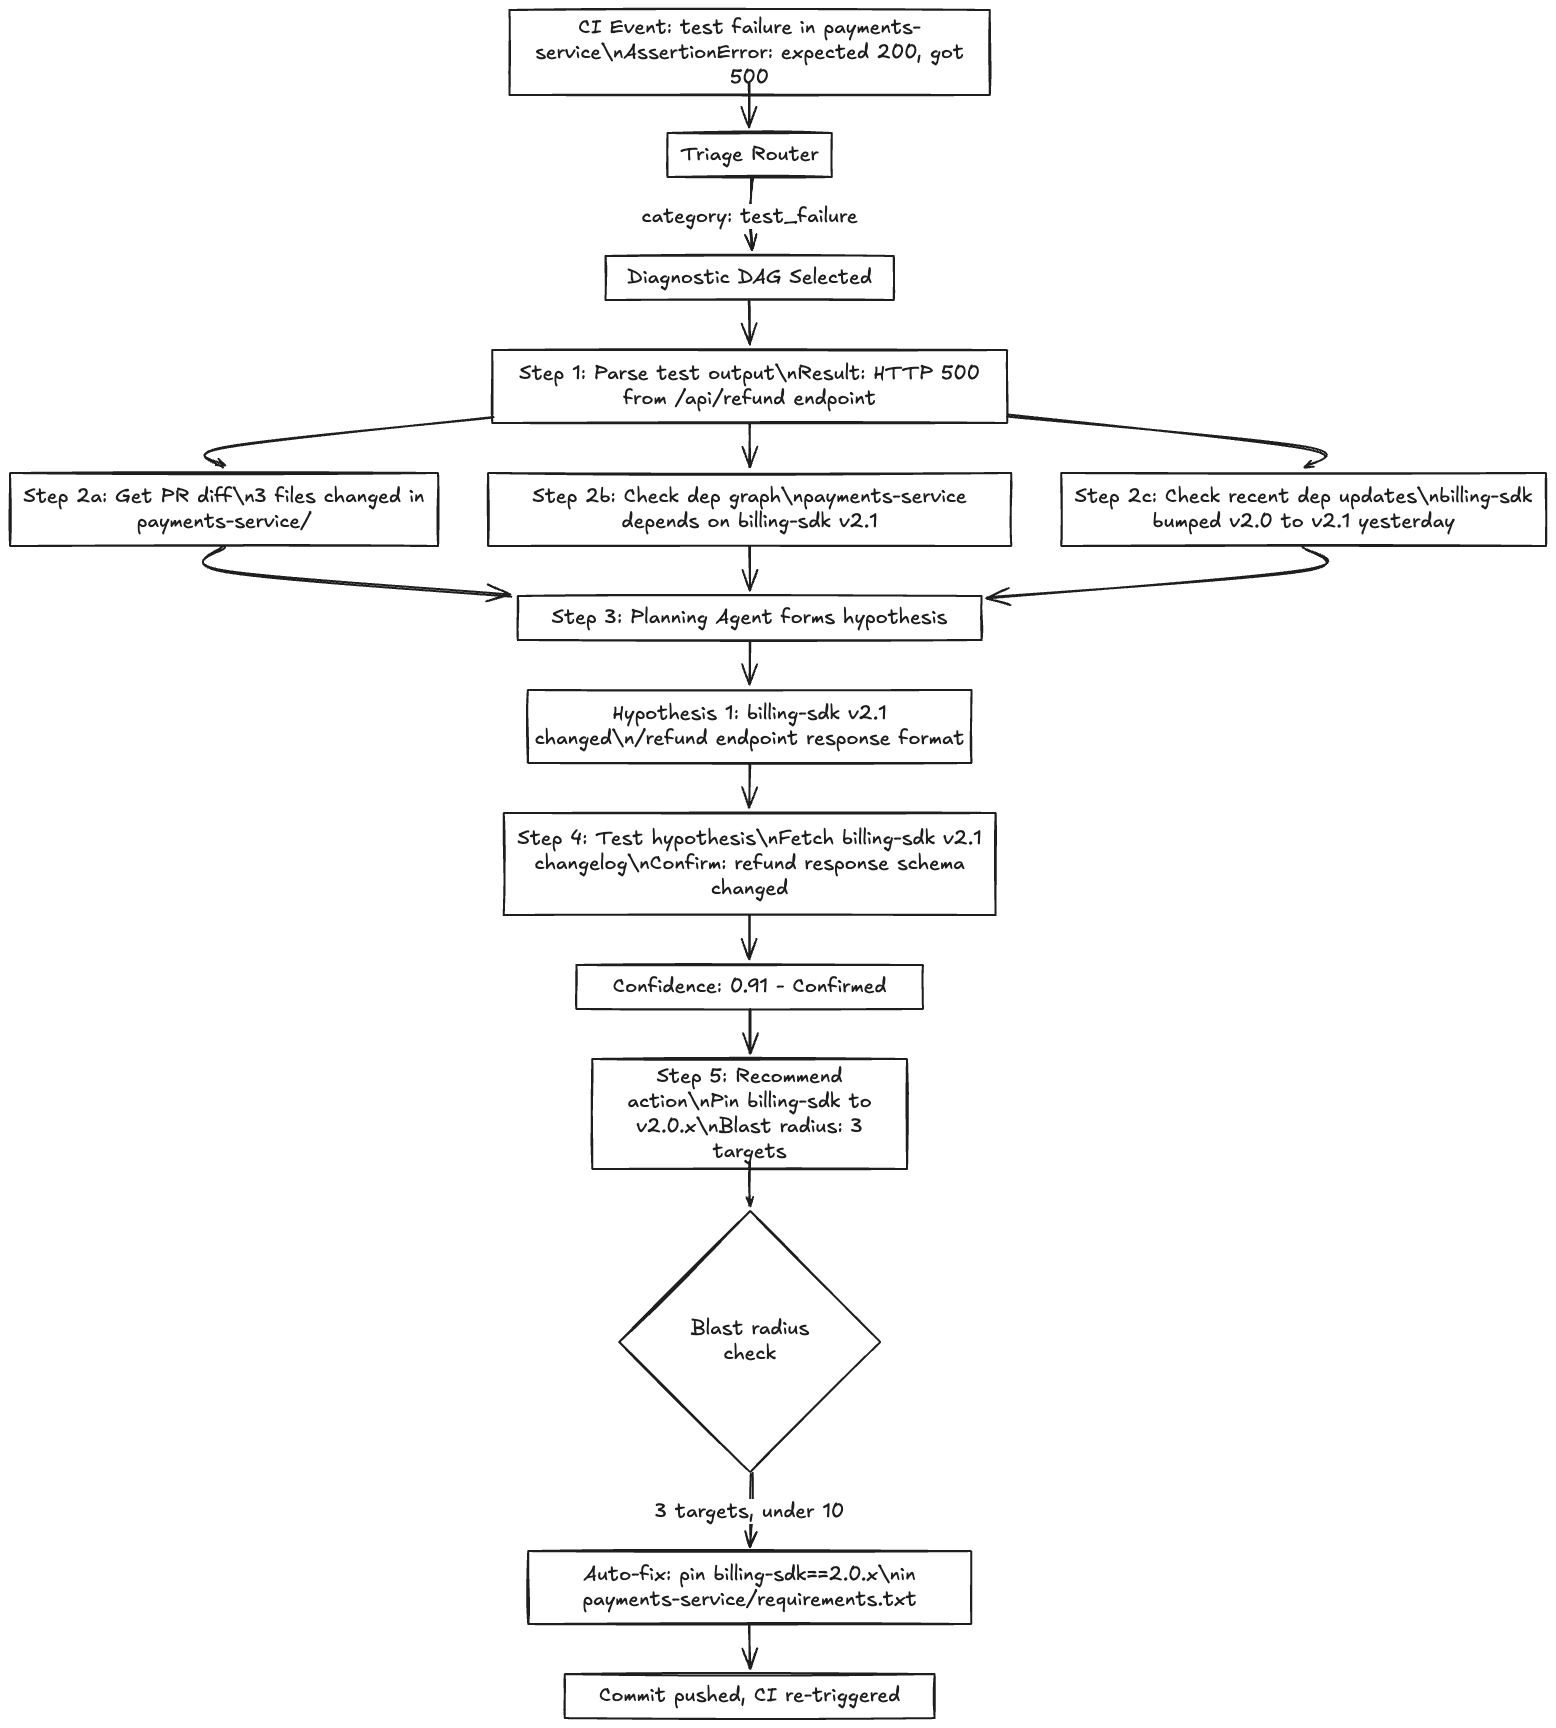
- CI system detects failure, publishes event to event bus
- Event consumer picks up the event, enriches it with metadata (PR author, changed files, target names)
- Triage router classifies the failure type and selects the appropriate diagnostic DAG
- DAG executor runs the diagnostic steps, invoking tools and the Planning Agent as needed
- Action policy evaluates the recommended action against blast radius and autonomy rules
- Action executor either takes the action autonomously or escalates to the developer
Tool Composition and the Tool Registry
The Planning Agent doesn’t call raw APIs. It calls tools from a versioned registry. Each tool is a composed operation that may internally call multiple lower-level functions.

For example, the diagnose_build_failure tool internally orchestrates:
class DiagnoseBuildFailure(Tool):
    version = "2.3.0"
    blast_radius = "read_only"  # This tool only reads, never writes

    def execute(self, build_log_url: str, pr_number: int) -> BuildDiagnosis:
        # Step 1: Parse the build log
        parsed = self.tools.parse_build_log(build_log_url)

        # Step 2: Get the PR diff
        diff = self.tools.get_pr_diff(pr_number)

        # Step 3: Check dependency graph for failing targets
        dep_info = self.tools.check_dependency_graph(
            targets=parsed.failing_targets
        )

        # Step 4: Check if lockfile changed
        lockfile_diff = self.tools.diff_lockfile(pr_number)

        # Step 5: LLM diagnosis with all context
        diagnosis = self.planning_agent.diagnose(
            error=parsed.error_summary,
            diff=diff,
            dependencies=dep_info,
            lockfile_changes=lockfile_diff
        )

        return diagnosis
The composition is important for two reasons. First, it keeps the Planning Agent’s context focused. Instead of dumping the raw build log (50,000 lines) into the LLM context, parse_build_log extracts the relevant error messages and failing targets (maybe 200 lines). The LLM sees a curated summary, not raw output. This matters for both cost and accuracy.
Second, tool versioning tracks compatibility with the CI toolchain. When the organization upgrades from Bazel 6 to Bazel 7, the parse_build_log tool needs to understand the new log format. Bumping the tool version (and keeping the old version for in-flight diagnoses) prevents the agent from misinterpreting logs during the migration.
Tool Version Drift
This is a failure mode specific to CI agents. The tools the agent uses are tightly coupled to the CI toolchain version. A Bazel version upgrade changes:
- Build log format (new error message structure)
- Dependency graph query syntax
- Lockfile format
- Target naming conventions
If the agent’s tools aren’t updated in sync with the toolchain, diagnoses break silently. The build log parser extracts the wrong fields. The dependency graph query returns empty results. The agent confidently diagnoses the wrong root cause because it’s reading stale data.
Mitigation: pin each tool to a toolchain version range. When a tool receives input from a toolchain version outside its supported range, it returns an explicit UNSUPPORTED_VERSION error instead of attempting to parse. The agent escalates immediately rather than reasoning over garbage data.
{
  "tool": "parse_build_log",
  "version": "2.3.0",
  "supported_toolchain": {
    "bazel": ">=6.0.0,<8.0.0",
    "gradle": ">=8.0,<9.0"
  },
  "input_schema": {
    "build_log_url": "string",
    "toolchain": "string",
    "toolchain_version": "string"
  }
}Handling Large Context
A monorepo build log can be 50,000+ lines. A test failure output can include stack traces, assertion details, and environment info totaling 5,000 lines. The PR diff for a large change can be thousands of lines. You cannot dump all of this into an LLM context window, even with 128K context models.
The approach: hierarchical summarization with targeted detail retrieval.
| Stage | What the LLM sees | Token budget |
|---|---|---|
| Stage 1: Triage | Error summary (last 50 lines of build log), failure category, target name | 500-1,000 tokens |
| Stage 2: Hypothesis formation | Error summary + PR diff summary (changed files and key hunks) + dependency overview | 2,000-4,000 tokens |
| Stage 3: Hypothesis testing | Targeted detail retrieval. If hypothesis is “dependency conflict in package X,” pull the specific lockfile diff for X and its dependency subtree | 1,000-3,000 tokens |
| Stage 4: Action planning | Confirmed diagnosis + specific code/config context needed for the fix | 1,000-2,000 tokens |
Total per diagnosis: 4,500-10,000 tokens. At $0.01-0.03 per 1K input tokens (frontier model pricing), that’s $0.05-0.30 per diagnosis. Acceptable for the value delivered.
The key insight: the LLM never sees the full build log. A deterministic parser extracts the relevant portions. The LLM reasons over curated, focused context. This is both cheaper and more accurate than dumping everything into the context and hoping the model finds the relevant needle.
Failure Modes
CI agents have failure modes that are different from conversational agents. The agent operates autonomously on production infrastructure, so failures have real consequences.
1. Cascading Automated Fix Loops
Covered in Step 4 but worth reiterating because it’s the highest-impact failure mode. Agent fixes A, fix causes B, agent fixes B, fix causes C. Each fix is locally reasonable but the chain is globally destructive.
The fix count limit (max 2 per PR per run) and rollback-on-re-failure are the primary safeguards. But the deeper fix is ensuring the agent never auto-fixes two coupled issues in sequence. If fix A modifies the dependency graph, the agent should not auto-fix any failure in a target that depends on the target that fix A modified. That’s a dependency-aware fix scope check.
2. Stale Diagnosis from Cached Build Logs
Developer pushes commit A, CI fails, agent starts diagnosing. While the agent is diagnosing, the developer pushes commit B (a fix attempt). The agent’s diagnosis is based on commit A’s build log, but the CI system is now running commit B. The agent posts a diagnosis that’s already stale.
Mitigation: before posting a diagnosis or taking action, verify that the current HEAD of the PR branch matches the commit that triggered the diagnosis. If it doesn’t, discard the diagnosis. The new CI run will trigger a fresh diagnosis if needed.
def post_diagnosis(self, pr: PullRequest, diagnosis: Diagnosis):
    current_head = pr.get_head_sha()
    if current_head != diagnosis.trigger_commit_sha:
        # Developer pushed a new commit while we were diagnosing
        self.metrics.increment("stale_diagnosis_discarded")
        return  # Do nothing. New CI run will trigger fresh diagnosis

self.post_pr_comment(pr, diagnosis)3. Blast Radius Miscalculation
The dependency graph is stale. The agent thinks a file has 5 dependents but it actually has 200 because the graph hasn’t been rebuilt since yesterday’s refactoring. The agent auto-fixes with an incorrectly low blast radius estimate.
Mitigation: the dependency graph must be rebuilt (or incrementally updated) on every PR merge. The agent should refuse to estimate blast radius on a graph older than 4 hours. If the graph is stale, default to escalation.
4. Misdiagnosis Leading to Wrong Auto-Fix
The agent diagnoses a test failure as a flaky test (because the test has been flaky before) and auto-retries. But this time the failure was genuine, not flaky. The retry passes by coincidence (the test has a race condition that fails 30% of the time). The developer merges the PR thinking CI is green.
This is the subtlest failure mode because everything looks fine. The agent retried, the test passed, the PR merged. The bug ships.
Mitigation: for tests with a known flake rate above 10%, don’t auto-retry once. Retry N times where N is enough to distinguish flake from genuine failure given the historical flake rate. If a test fails 30% of the time due to a flake, 3 passing retries gives reasonable confidence it’s not a genuine failure (0.7^3 = 34% chance all 3 pass if genuinely broken). For most tests, 2-3 retries is sufficient.
5. Agent Actions Conflicting with Developer’s In-Progress Fix
The developer sees the CI failure, starts working on a fix, and pushes it. Meanwhile, the agent also diagnoses the failure and pushes its own fix. Now there are two competing fixes on the PR branch.
Mitigation: before pushing any auto-fix commit, check if the PR branch has been updated since the failure event. If the developer has pushed in the last 5 minutes, the agent should wait and observe rather than act. The developer is likely already working on it.
Operational Concerns
Monitoring the Agent Itself
The agent is a production system that takes autonomous actions. It needs its own observability, separate from the CI pipeline it monitors.
| Metric | What it tells you | Alert threshold |
|---|---|---|
| Diagnosis rate (diagnosed / total failures) | How often the agent produces a useful diagnosis | Below 50% means tool breakage or new failure patterns |
| Auto-fix success rate | Fixes that resolved the CI failure | Below 80% means the action policy is too aggressive |
| Auto-fix revert rate | Fixes that were rolled back due to causing new failures | Above 3% means stop auto-fixes and audit |
| Mean time to diagnosis | End-to-end from failure event to diagnosis posted | Above 5 minutes means something is slow (tool, LLM, event bus) |
| Escalation rate | Failures that went to developer without auto-fix | Track trend, not absolute. Rising rate means new failure patterns the agent can’t handle |
| Stale diagnosis rate | Diagnoses discarded because developer pushed a new commit | Above 30% means the agent is too slow or developers are too fast |
| Tool error rate by tool | Which tools are failing | Spike in one tool usually means toolchain version drift |
Cost Tracking
| Component | Cost per failure | Notes |
|---|---|---|
| LLM inference (diagnosis) | $0.05-0.15 | Varies with context size and hypothesis count |
| LLM inference (action planning) | $0.02-0.05 | Only for failures that get auto-fixed |
| Tool invocations | Negligible | Internal API calls, no external cost |
| Compute (DAG executor, triage router) | Negligible | Small stateless services |
| CI re-runs (from auto-retries) | $0.50-2.00 | The largest cost. CI compute for retry is expensive |
| Total per failure (diagnosed + auto-fixed) | $0.60-2.20 | Dominated by CI re-run cost, not inference |
The insight from this breakdown: inference cost is a small fraction of the total. The expensive part is CI compute for retries and re-runs. Optimizing LLM cost matters less than optimizing diagnosis accuracy (which reduces unnecessary retries).
Developer Trust and Adoption
The agent’s value depends entirely on developer trust. If developers learn to ignore the agent’s comments, it’s useless regardless of accuracy. Trust is built through:
- Transparency: Every PR comment includes the evidence and reasoning, not just the conclusion. Developers can verify the diagnosis.
- Humility: When confidence is below threshold, the agent says “I’m not sure, here’s what I found” rather than making a confident wrong claim.
- Reversibility: Every auto-fix is a separate commit that can be trivially reverted. The developer is never stuck with the agent’s change.
- Opt-out: Teams can disable auto-fixes for their targets while still getting diagnostic comments. This lets teams adopt incrementally.
A gradual rollout is critical. Start with diagnosis-only mode (no auto-fixes) for the first month. Let developers validate diagnosis accuracy before enabling autonomous actions. Then enable auto-fixes for safe actions only (retries, import fixes). Then gradually expand scope as trust builds and accuracy metrics are validated.
Going Deeper
Episodic memory for recurring failures: Some targets fail repeatedly for the same reason. Target X has been flaky for 3 weeks. Target Y breaks every time someone updates dependency Z. An episodic memory store (target ID to failure history) lets the agent skip hypothesis generation for known patterns. “Target X failed. Last 10 failures were all flaky test (network timeout in integration test). Retrying without diagnosis.” This cuts diagnosis time from minutes to seconds for high-frequency failure targets. The memory has a TTL (30 days) to avoid acting on stale patterns.
Multi-language monorepo support: A real monorepo has Go services, Python ML pipelines, TypeScript frontends, and Terraform infrastructure configs. Each language has different build tools, different error formats, different dependency management. The tool registry needs language-aware tool variants: parse_build_log_bazel, parse_build_log_gradle, parse_build_log_webpack. The triage router’s first job is identifying the language/toolchain, which determines the entire diagnostic DAG.
Integration with code review agents: If the organization also runs a code review agent (covered in the next case study), the two agents can share context. The code review agent flagged a potential concurrency issue in the PR. The CI agent sees a flaky test failure. The CI agent checks the review agent’s findings and strengthens its hypothesis: “The test failure pattern matches the concurrency issue flagged during review.” This cross-agent signal is more valuable than either agent in isolation.
Handling CI configuration as code: In many monorepos, CI configuration is checked in alongside the code (GitHub Actions workflows, Buildkite pipeline files). When a PR modifies CI configuration and the pipeline fails, the agent needs to reason about meta-failures: the pipeline definition itself is broken. This requires a different diagnostic path because the error isn’t in application code or dependencies but in the CI orchestration layer. These failures should almost always escalate (modifying CI config autonomously is too risky) but the diagnosis is still valuable.
References
[1] Anthropic — Building Effective Agents
[2] Temporal — Durable Execution Platform
[3] Prefect — Workflow Orchestration
[5] Buildkite — CI/CD Platform
[7] Google — Build System: Build, Test, and CI at Scale
[8] Meta — Sapling SCM and Monorepo Tooling
[9] Uber — Monorepo Dependency Management
[10] Shopify Engineering — Building Production-Ready Agentic Systems
Note: This blog represents my technical views and production experience. I use AI-based tools to help with drafting and formatting to keep these posts coming daily.
← Back to all posts